

User guide4 min
A page report
A page report shows everything the scan found about one URL, in ten tabs: findings, links, images, structured data and more. Use it before you edit a page, to see everything wrong with it at once.
How to get there#
Can't find it in the sidebar? It has no sidebar entry. Click a page almost anywhere in PixyScan and its report opens.
- 1
Click a row on the Pages screen
The most common way in. Both the table and the tree open it.
- 2
Or click a row on a finding's Affected pages tab
You already know this page has one problem. The report shows what else is wrong with it.
- 3
Or click a page on another screen
Content, Links, Images, Schema, Social, Structure, Trust, the Pages changed tab of Changes and the search box all link to page reports.
app.pixyscan.com/w/…/s/…/pages/…
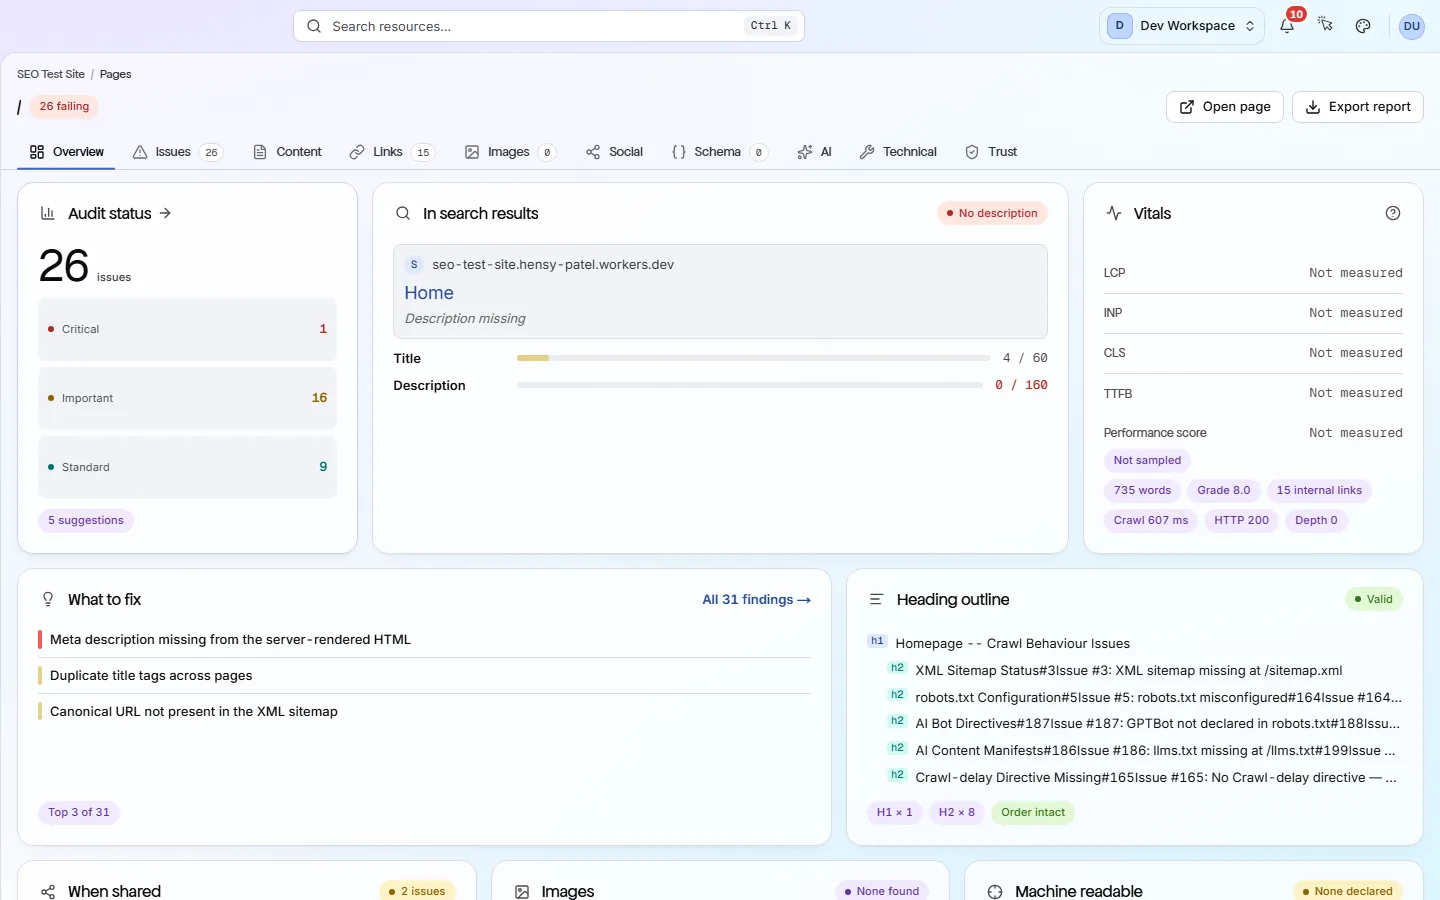
What the Overview shows#
A set of cards that sum up the page, one topic each.
| Field | Shows | What it does |
|---|---|---|
| Audit status | Counts by severity | How many findings this page has at each severity. |
| In search results | A preview | How the title and description may look in Google, with a bar showing if each is too long or too short. |
| Vitals | LCP, INP, CLS, TTFB | Core Web Vitals (Google's page speed scores). Empty? They show only if this page was sampled for speed, which needs the Hobby tier or above and a Google API key. The card also shows word count, reading grade, internal links, status and depth. |
| What to fix | Top 3 | The three most serious findings on this page, with a link to the full list. |
| Heading outline | h1 … h6 | The page's headings in order, so you can check the structure makes sense. |
| When shared · Images · Machine readable · Page weight | Four cards | How the page looks when shared on social media, a summary of its images, its structured data, and how heavy it is to download. |
The ten tabs#
Most tabs match a screen in the sidebar, but show only this one page.
| Field | Matches | What it does |
|---|---|---|
| Overview | - | The summary cards described above. |
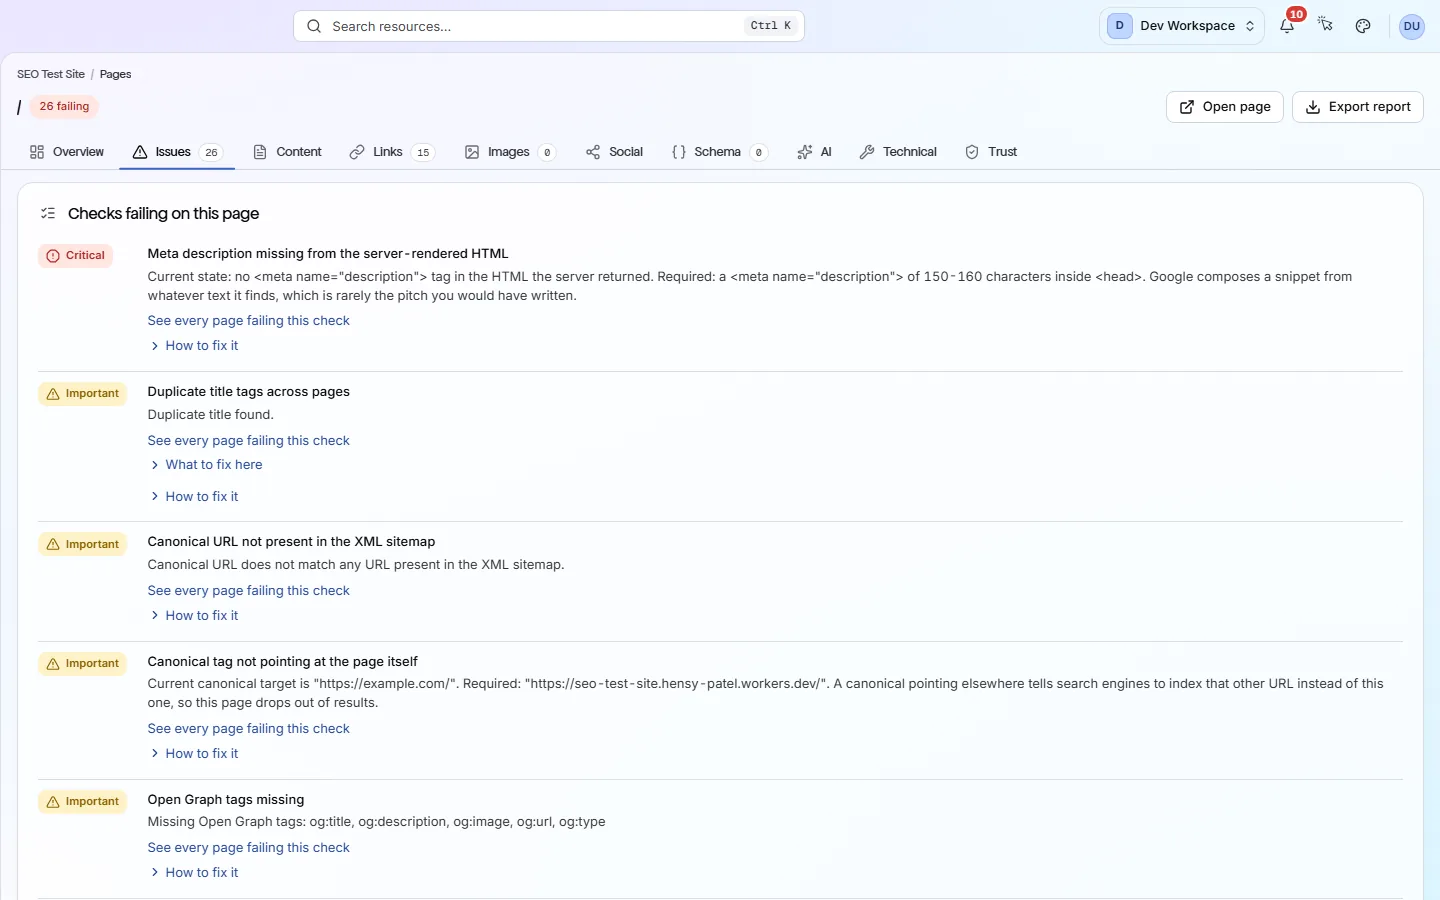
| Issues | Issues | Every finding on this page, with its severity and the points it is costing. |
| Content | Content | The page's title, meta description, headings, word count and readability. |
| Links | Links | The links on this page, and the other pages that link to it. |
| Images | Images | Every image on the page, with its alt text, format and size. |
| Social | Social | The page's Open Graph and Twitter/X tags. They control the preview shown when someone shares the link. |
| Schema | Schema | The page's structured data (hidden labels that help search engines understand it). |
| AI | AI readiness | How easily AI answer engines can read and quote this page. |
| Technical | Crawlability | The status code, the canonical URL (the version you want search engines to use), robots rules and whether the page can be indexed. |
| Trust | Trust | Whether the page uses HTTPS, its certificate, its security headers and any files it loads over insecure HTTP. |
app.pixyscan.com/w/…/s/…/pages/…/issues
Live page looks different from the report?
Does something here not match what you see in the app? Tell us