

User guide2 min
Workspace alerts
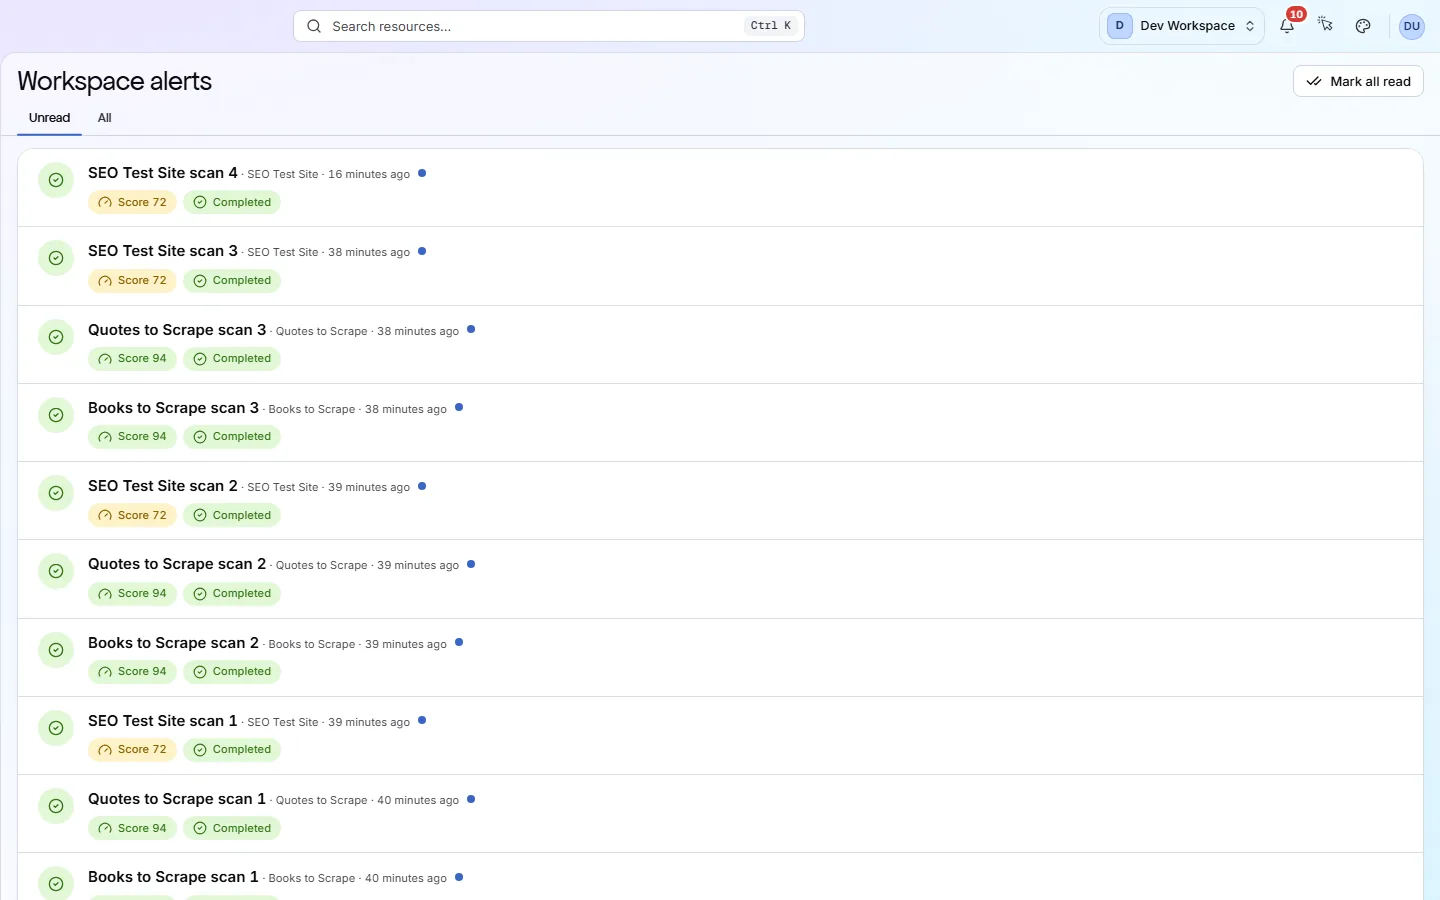
Workspace alerts lists what happened on every site in the workspace, newest first, one row per scan. It is the same list as the bell in the top bar, on a full screen.
How to get there#
Two ways into the same list.
- 1
Choose Workspace alerts in the workspace sidebar
It is under Sites in the sidebar you see when no site is open. It opens on the Unread tab.
- 2
Or click the bell in the top bar
The bell works from any screen. Its badge shows how many alerts are unread. It opens the same rows and tabs in a side panel.
app.pixyscan.com/w/…/alerts
Reading a row#
The first line names the scan. The second shows what it found.
| Field | Example | What it does |
|---|---|---|
| Title | Node.js scan 3 | The scan's name, its site, and how long ago it ran. |
| Score | Score 84 | Shown when the health score fell below the site's score gate (the lowest score you accept). The gate is 97 unless you change it under Settings → SDK & CI/CD. |
| Movement | 84 → 83 | Shown when the score dropped since the previous scan. |
| New critical issue | Named | A critical check is failing now that the previous scan did not report. You see the check's name, or a count if there are several. |
| Status | Completed | Completed when the scan finished, or Failed with a short reason. If a scan was retried, only the latest result is shown. |
| Dot | Unread | Marks a row nobody has opened yet. It clears when the row is opened. |
Click a row to open that scan. Score and critical-issue alerts open the scan's Issues screen. Other alerts open its overview. Mark all read clears every unread row at once.
Workspace admins also get a row when someone accepts or declines an invitation. It links to Members.
Why did an alert disappear from Unread?
Email, Slack and webhook alerts are set per site
Does something here not match what you see in the app? Tell us